Query by committee
Query by committee is another popular active learning strategy, which alleviates many disadvantages of uncertainty sampling. For instance, uncertainty sampling tends to be biased towards the actual learner and it may miss important examples which are not in the sight of the estimator. This is fixed by keeping several hypotheses at the same time, selecting queries where disagreement occurs between them. In this example, we shall see how this works in the simplest case, using the iris dataset.
The executable script for this example is available here!
To enforce a reproducible result across runs, we set a random seed.
[1]:
import numpy as np

# Set our RNG seed for reproducibility.
RANDOM_STATE_SEED = 1
np.random.seed(RANDOM_STATE_SEED)
The dataset
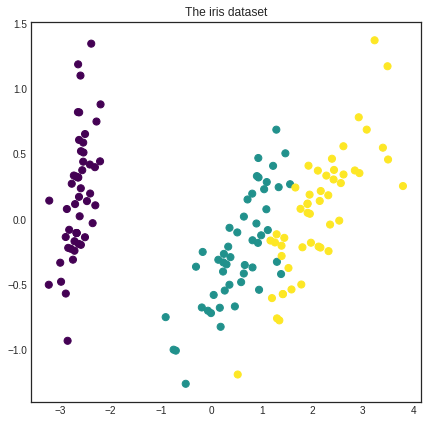
We are going to use the iris dataset for this example. For more information on the iris dataset, see its wikipedia page. For its scikit-learn interface, see the scikit-learn documentation.
[2]:
import matplotlib as mpl
import matplotlib.pyplot as plt
%matplotlib inline
from sklearn.decomposition import PCA
from sklearn.datasets import load_iris

# loading the iris dataset
iris = load_iris()

# visualizing the classes
with plt.style.context('seaborn-white'):
    plt.figure(figsize=(7, 7))
    pca = PCA(n_components=2).fit_transform(iris['data'])
    plt.scatter(x=pca[:, 0], y=pca[:, 1], c=iris['target'], cmap='viridis', s=50)
    plt.title('The iris dataset')
    plt.show()
Initializing the Committee
In this example, we are going to use the Committee class from modAL.models. Its interface is almost exactly identical to the ActiveLearner. Upon initialization, Committee requires a list of active learners. First, we generate the pool of unlabeled data.
[3]:
from copy import deepcopy

# generate the pool
X_pool = deepcopy(iris['data'])
y_pool = deepcopy(iris['target'])
Now we are ready to initialize the Committee. For this, we need a list of ActiveLearner objects, which we will define now.
[4]:
import numpy as np
from sklearn.ensemble import RandomForestClassifier
from modAL.models import ActiveLearner, Committee

# initializing Committee members
n_members = 2
learner_list = list()

for member_idx in range(n_members):
    # initial training data
    n_initial = 2
    train_idx = np.random.choice(range(X_pool.shape[0]), size=n_initial, replace=False)
    X_train = X_pool[train_idx]
    y_train = y_pool[train_idx]

    # creating a reduced copy of the data with the known instances removed
    X_pool = np.delete(X_pool, train_idx, axis=0)
    y_pool = np.delete(y_pool, train_idx)

    # initializing learner
    learner = ActiveLearner(
        estimator=RandomForestClassifier(),
        X_training=X_train, y_training=y_train
    )
    learner_list.append(learner)

# assembling the committee
committee = Committee(learner_list=learner_list)
/home/namazu/.local/lib/python3.6/site-packages/sklearn/ensemble/weight_boosting.py:29: DeprecationWarning: numpy.core.umath_tests is an internal NumPy module and should not be imported. It will be removed in a future NumPy release.
  from numpy.core.umath_tests import inner1d
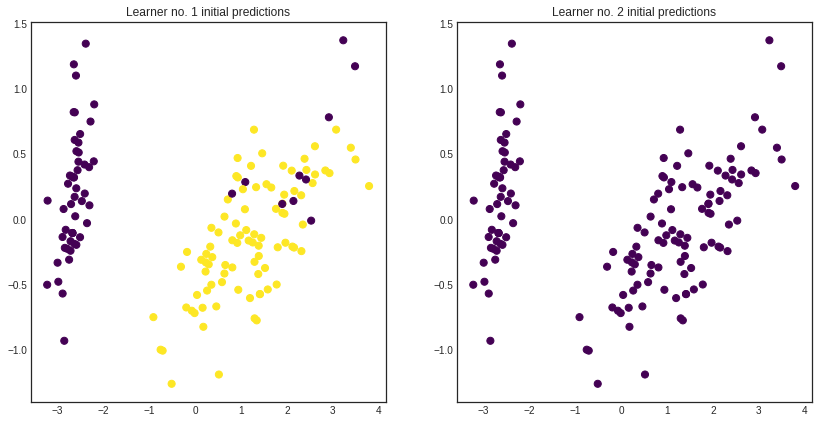
As you can see, the various hypotheses (which are taking the form of ActiveLearners) can be quite different.
[5]:
with plt.style.context('seaborn-white'):
    plt.figure(figsize=(n_members*7, 7))
    for learner_idx, learner in enumerate(committee):
        plt.subplot(1, n_members, learner_idx + 1)
        plt.scatter(x=pca[:, 0], y=pca[:, 1], c=learner.predict(iris['data']), cmap='viridis', s=50)
        plt.title('Learner no. %d initial predictions' % (learner_idx + 1))
    plt.show()
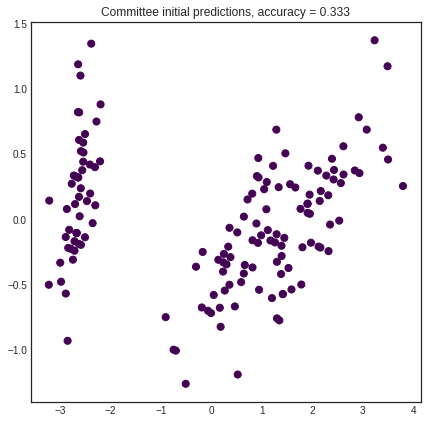
Prediction is done by averaging the class probabilities for each learner and chosing the most likely class.
[6]:
unqueried_score = committee.score(iris['data'], iris['target'])

with plt.style.context('seaborn-white'):
    plt.figure(figsize=(7, 7))
    prediction = committee.predict(iris['data'])
    plt.scatter(x=pca[:, 0], y=pca[:, 1], c=prediction, cmap='viridis', s=50)
    plt.title('Committee initial predictions, accuracy = %1.3f' % unqueried_score)
    plt.show()
Active learning
The active learning loop is the same as for the ActiveLearner.
[7]:
performance_history = [unqueried_score]

# query by committee
n_queries = 20
for idx in range(n_queries):
    query_idx, query_instance = committee.query(X_pool)
    committee.teach(
        X=X_pool[query_idx].reshape(1, -1),
        y=y_pool[query_idx].reshape(1, )
    )
    performance_history.append(committee.score(iris['data'], iris['target']))
    # remove queried instance from pool
    X_pool = np.delete(X_pool, query_idx, axis=0)
    y_pool = np.delete(y_pool, query_idx)
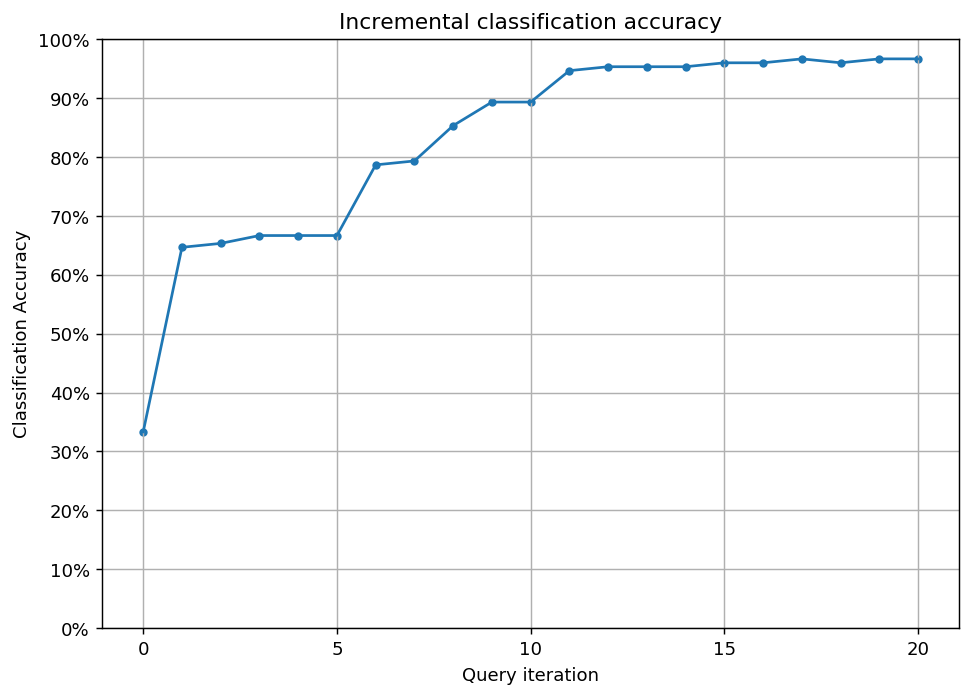
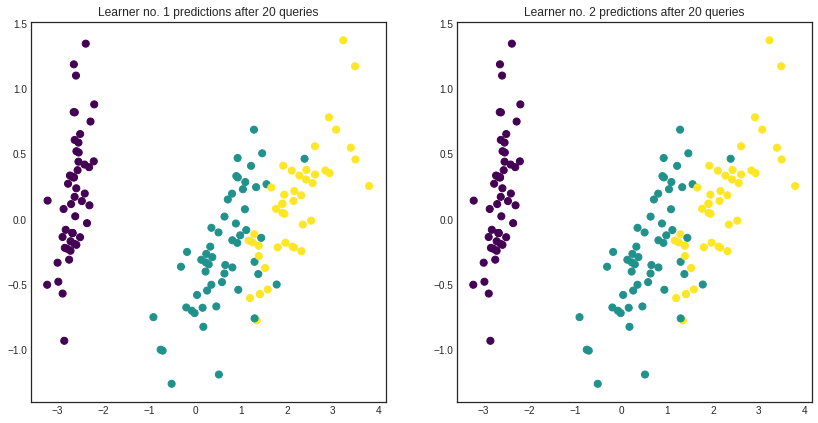
After a few queries, the hypotheses straighten out their disagreements and they reach consensus. Prediction accuracy is greatly improved in this case.
[8]:
# visualizing the final predictions per learner
with plt.style.context('seaborn-white'):
    plt.figure(figsize=(n_members*7, 7))
    for learner_idx, learner in enumerate(committee):
        plt.subplot(1, n_members, learner_idx + 1)
        plt.scatter(x=pca[:, 0], y=pca[:, 1], c=learner.predict(iris['data']), cmap='viridis', s=50)
        plt.title('Learner no. %d predictions after %d queries' % (learner_idx + 1, n_queries))
    plt.show()
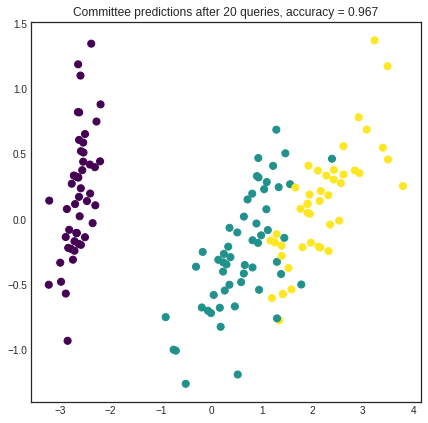
[9]:
# visualizing the Committee's predictions
with plt.style.context('seaborn-white'):
    plt.figure(figsize=(7, 7))
    prediction = committee.predict(iris['data'])
    plt.scatter(x=pca[:, 0], y=pca[:, 1], c=prediction, cmap='viridis', s=50)
    plt.title('Committee predictions after %d queries, accuracy = %1.3f'
              % (n_queries, committee.score(iris['data'], iris['target'])))
    plt.show()
[10]:
# Plot our performance over time.
fig, ax = plt.subplots(figsize=(8.5, 6), dpi=130)

ax.plot(performance_history)
ax.scatter(range(len(performance_history)), performance_history, s=13)

ax.xaxis.set_major_locator(mpl.ticker.MaxNLocator(nbins=5, integer=True))
ax.yaxis.set_major_locator(mpl.ticker.MaxNLocator(nbins=10))
ax.yaxis.set_major_formatter(mpl.ticker.PercentFormatter(xmax=1))

ax.set_ylim(bottom=0, top=1)
ax.grid(True)

ax.set_title('Incremental classification accuracy')
ax.set_xlabel('Query iteration')
ax.set_ylabel('Classification Accuracy')

plt.show()